The conventional wisdom is that temperatures measured at the lid will be higher than those measured at the top cooking grate, and that temperatures at the top grate will be higher than those at the bottom grate. Is this true? If so, what are the temperature differences?
In 1999, I conducted two “experiments” by measuring temperatures in an empty cooker and during a cook of two pork butts. I concluded that the lid temperature averages 12-15°F higher than the top grate temperature, and the top grate averages 4-10°F higher than the bottom grate.
- Temperature Experiment 9/29/99 (Excel Spreadsheet | PDF)
- Temperatures Measured While Cooking 10/3/99 (Excel Spreadsheet | PDF)
Of course, two “experiments” cannot adequately explain the complex temperature dynamic inside the WSM, and they don’t take into account different types and quantities of meat or water pan variations like using water or an empty pan. Obviously, further tests are warranted.
To continue this effort, I conducted a series of cooks to measure cooker temperatures using an empty water pan, a water-filled pan, and a sand-filled pan. The test method and results are described below. As I conduct more tests, I’ll post the results here.
Water Pan Test Method
In September and October 2003, I conducted three temperature “experiments” to test water pan variations in the WSM.
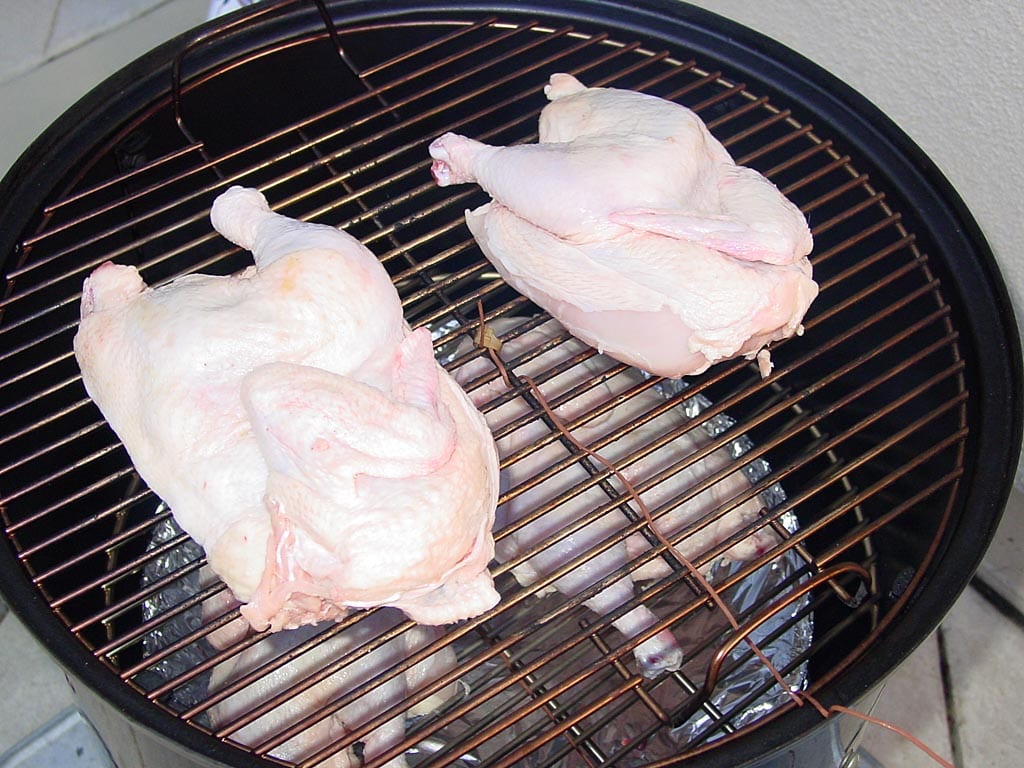
Each session consisted of cooking 2 whole chickens. All chickens were fresh fryers weighing 3-1/2 to 3-3/4 pounds each. Each chicken was butterflied and cut in half.
Each session had a different water pan treatment:
Session #1
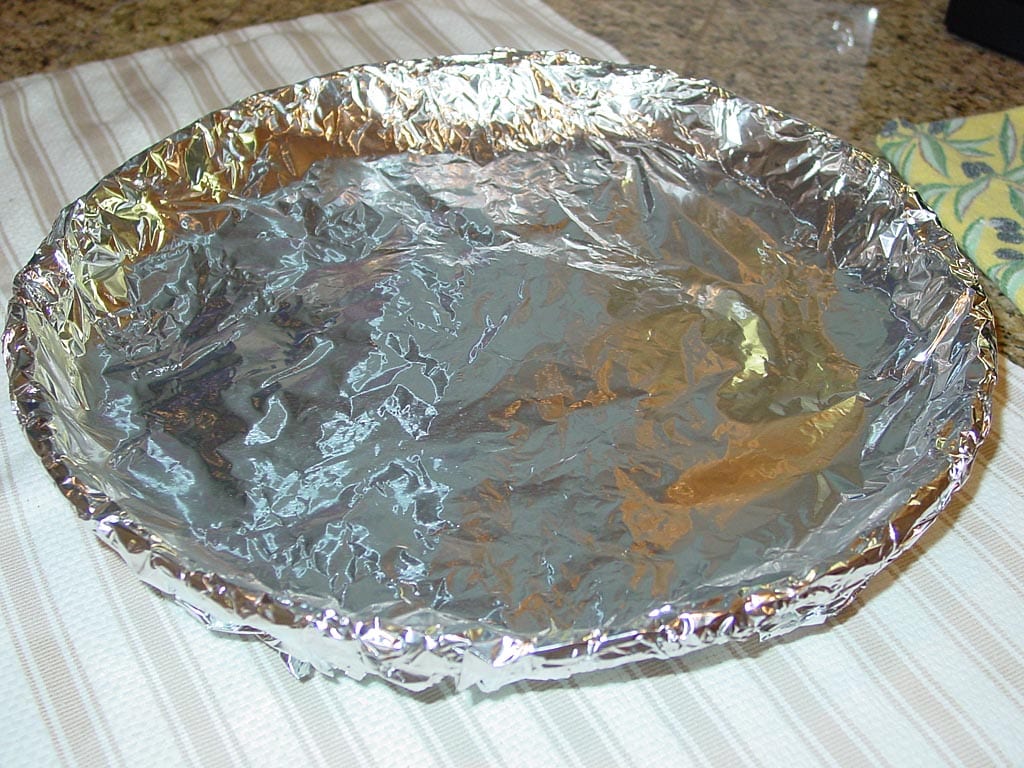
The water pan was empty. It was covered with wide, heavy duty aluminum foil inside and out.
Session #2
The water pan was filled with 1 gallon of hot tap water. Only the outside of the pan was covered with foil. The water was not replenished during the session.
Session #3
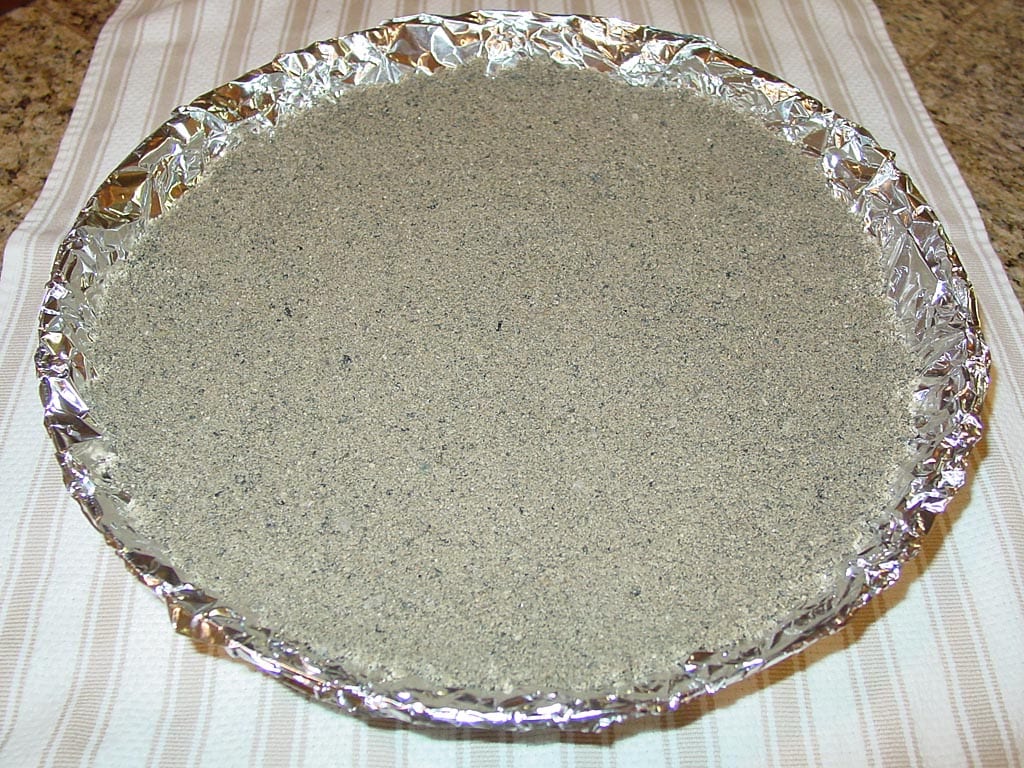
The water pan was filled with 8 pounds of clean playground sand. The pan was approximately 3/4 full. The pan was covered inside and out with foil, then the sand was added and compacted, then two layers of foil were placed over the sand. The sand-filled pan was at room temperature when placed inside the cooker.
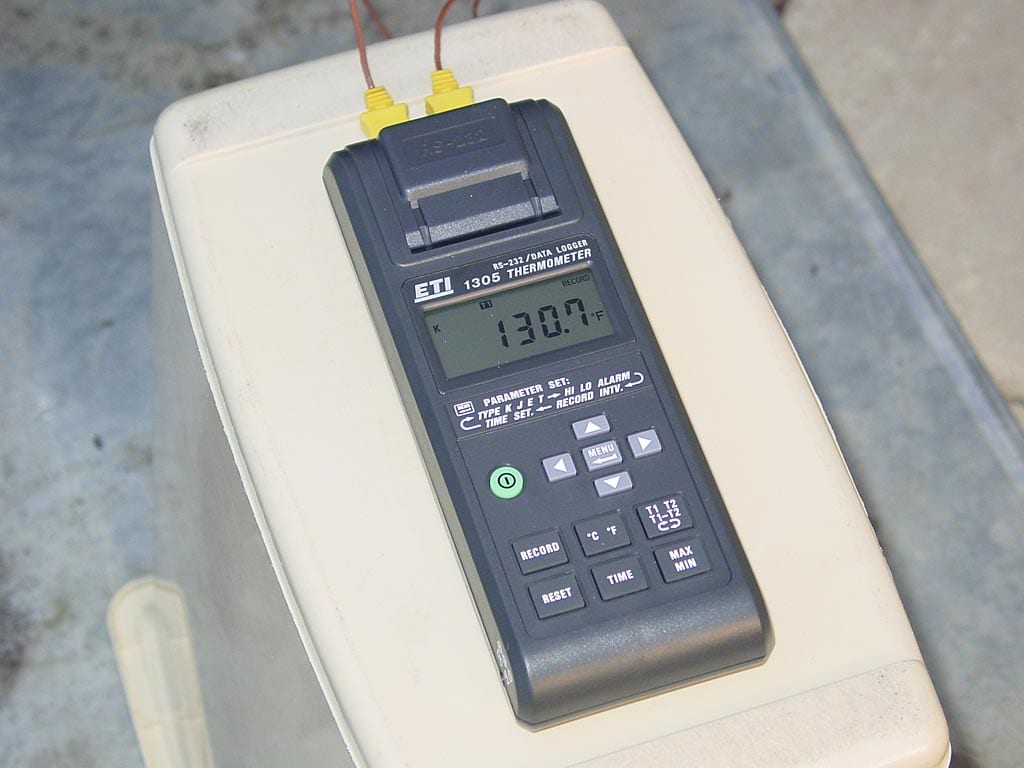
To measure temperature inside the cooker, a k-type bead probe thermocouple was attached to the center of each cooking grate.
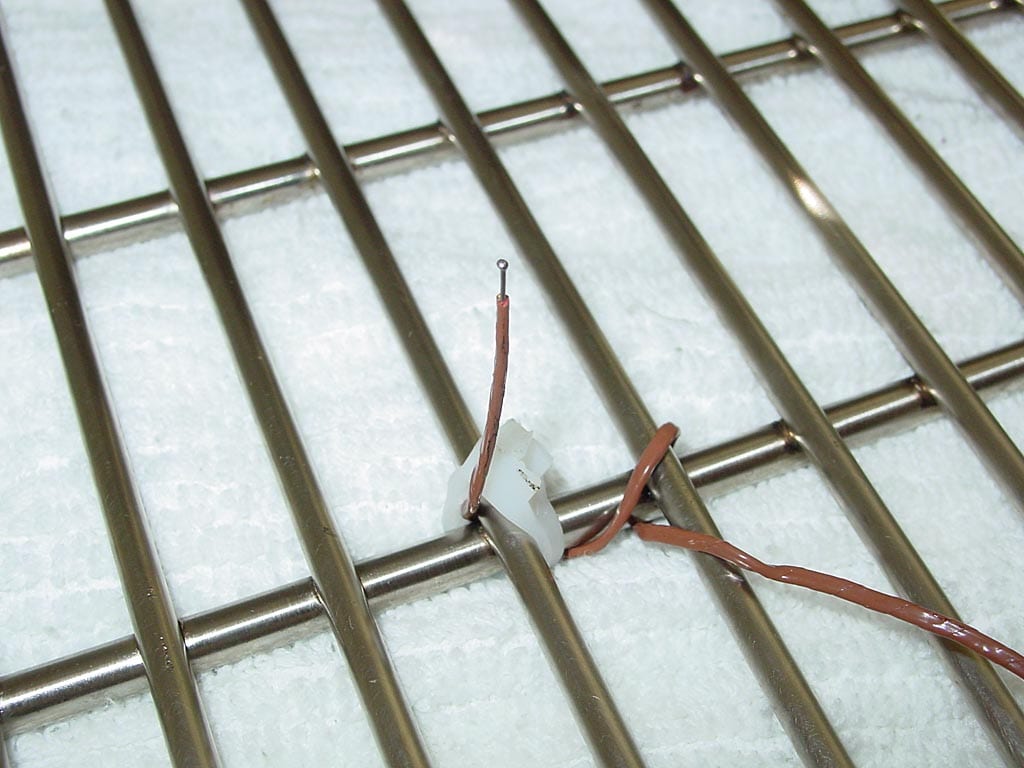
The bead was positioned 1-1/2″ above the grate surface. The ETI 1305 data logging thermometer recorded the temperature from each probe at 5 minute intervals.
To measure temperature at the lid, I checked the Trend Model 33 industrial-grade bi-metal thermometer at 15 minute intervals, manually recording the temperature in a cooking log. This thermometer is mounted in the lid opposite from the lid vent.
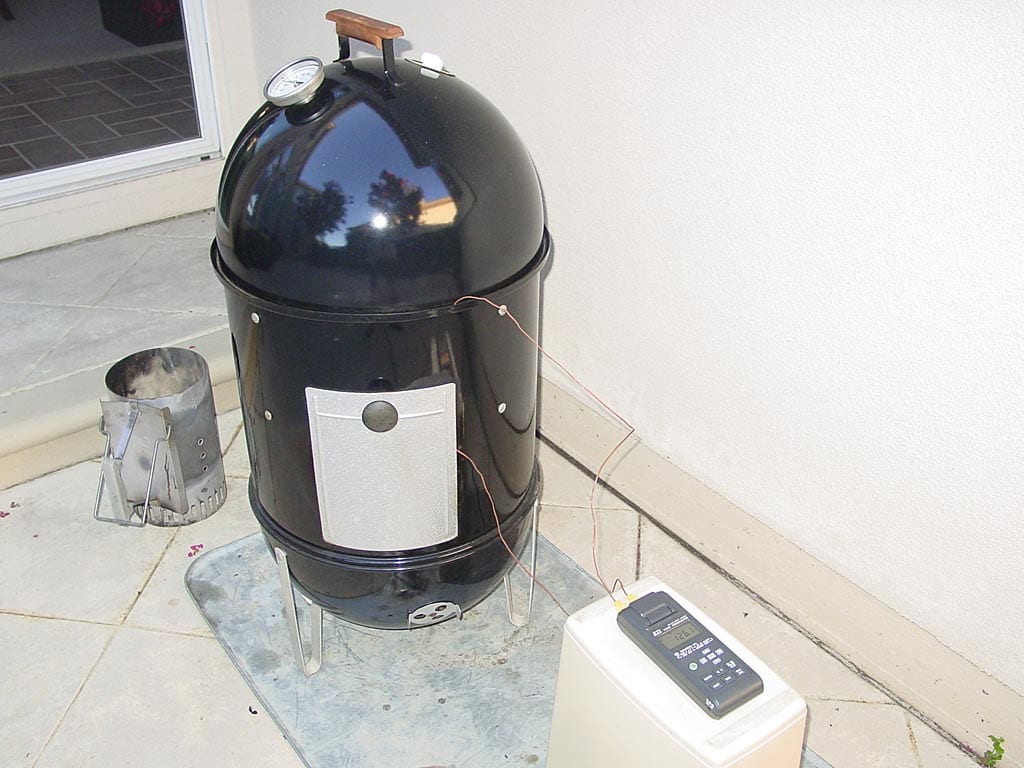
For each session, the cooker was fired with a 10-pound bag of Kingsford Charcoal Briquets using the Minion Method:
- Twenty coals were lit in a Weber chimney starter and spread evenly over the remaining unlit briquettes.
- The cooker was assembled and the chicken added immediately, straight from the refrigerator.
- No smoke wood was used in order eliminate it as a variable in the testing.
- A single bottom vent was used to control temperature, starting at 100% open and adjusted as necessary to maintain 225-250°F.
- The top vent was fully open at all times.
Each cooking session began at 7:45am and lasted 4 hours. Weather conditions were similar on each day: clear skies, calm conditions, outdoor temperatures starting in the mid 50’s and going no higher than 70°F by 11:45am. The WSM was shaded so that direct sunlight would not affect cooker temperature.
Water Pan Test Data
Graphs and data tables for each cook are shown below. Time represents the number of hours/minutes elapsed during each session. Bott Vent % represents the amount open a single bottom vent was set at the time indicated.
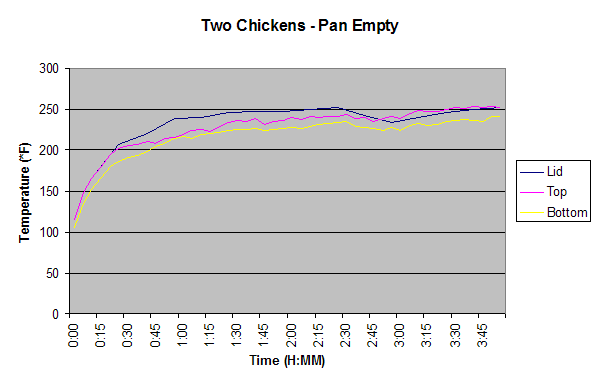
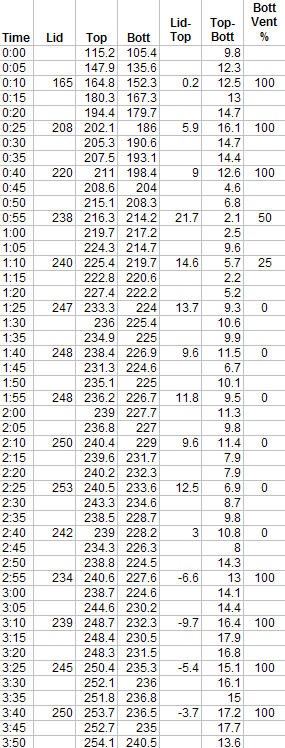
Data table for empty pan test
Pan Empty
Notice that the difference between the lid temp and top grate temp starts at 0.2°F at 0:10 and peaks at 21.7°F at 0:55. It then settles in at 10-15°F for a while, then goes negative during the last hour of the cook.
The difference between the top and bottom grates is 12-16°F at the beginning, then 2-11°F in the middle, then 13-17°F at the end of the cook.
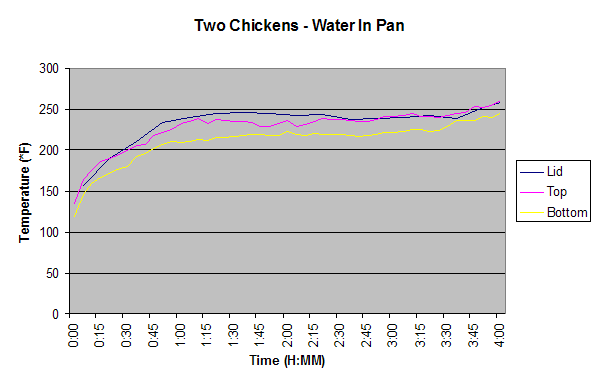
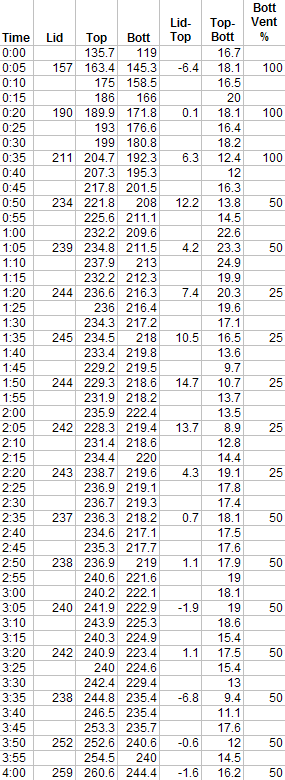
Data table for water pan test
Water In Pan
Notice that in this session, the difference between the lid temp and top grate temp starts a little lower, -6.4°F at 0:05, peaks at about 12°F, dips down to 4°F, visits 10-15°F for a while, then goes negative during the last hour of the cook—although not as negative as with the empty pan.
The difference between the top and bottom grates is consistently higher than with the empty pan, in the range of 12-18°F with a few spikes of 20-25°F.
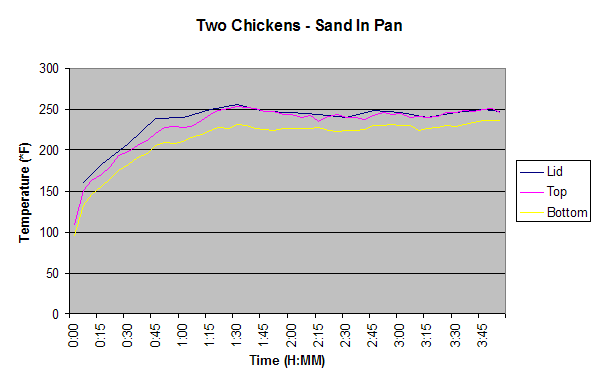
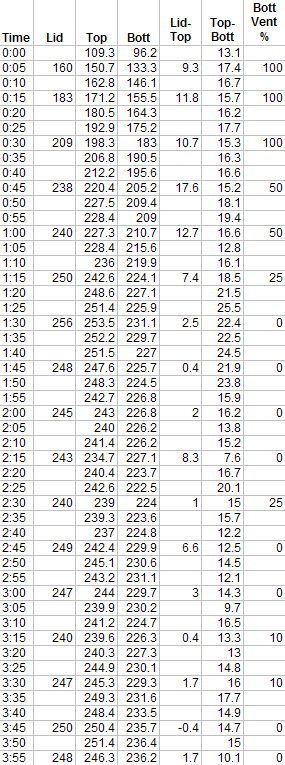
Temperature graph of sand pan test
Sand In Pan
Notice that in this session, the difference between the lid temp and top grate temp starts out at almost 10°F, peaks at 17.6°F, then wanders between 0-8°F (versus 10-15°F in the other sessions) before dipping to 0-3°F during the last hour. Note that temps hardly went negative compare to the other sessions.
Interestingly, the difference between the top and bottom grates is very similar to water in the pan, in the range of 13-20°F, but with about twice as many spikes of 22-25°F.
At the conclusion of this cook, I measured the temperature of the sand using an instant-read thermometer and got readings of 275-285°F in several locations.
Water Pan Test Statistics & Conclusions
Here are some statistics based on just the last three hours of each session, when the cooker was maintaining the 225-250°F target temperature. Given that there are far fewer data points for lid temperature, I have not included lid measurements in these statistics.
Top Grate Temperatures
| Ave temp °F | Min temp °F | Max temp °F | Standard dev | |
| Empty Pan | 239.8 | 219.7 | 254.1 | 9.16 |
| Water Pan | 238.8 | 228.3 | 260.6 | 7.35 |
| Sand Pan | 243.3 | 227.3 | 253.5 | 6.16 |
Bottom Grate Temperatures
| Ave temp °F | Min temp °F | Max temp °F | Standard dev | |
| Empty Pan | 228.7 | 214.7 | 240.5 | 6.07 |
| Water Pan | 222.7 | 211.5 | 244.4 | 8.14 |
| Sand Pan | 227.1 | 210.7 | 236.4 | 5.17 |
Difference Between Top & Bottom Grate Temperatures
| Ave diff °F | Min diff °F | Max diff °F | Standard dev | |
| Empty Pan | 11.1 | 2.2 | 17.9 | 4.11 |
| Water Pan | 16.1 | 8.9 | 24.9 | 3.72 |
| Sand Pan | 16.2 | 7.6 | 25.5 | 4.24 |
Here’s what I take away from the experience of conducting these three cooking sessions and looking at the raw data and summary tables above.
- My subjective impression was that none of these methods was difficult from a temperature control standpoint, but that using water was a little bit easier than either sand or an empty pan, both of which seemed about the same in terms of temperature control.
- The difference in temperature between the lid and top grate is quite variable regardless of water pan variation used. During the middle two hours of each session, the difference ranged from 0-15°F, then during the last hour the difference lessened and in two cases actually went negative. For the empty water pan cook, a 24°F difference was observed during the last three hours, from a high of 14.6°F to a low of -9.7°F.
- An empty water pan resulted in the lowest average difference between top and bottom grate temperatures, while water and sand were about the same at 5°F higher.
- Based on standard deviations, sand resulted in more stable top and bottom grate temperatures than either water or an empty pan. However, water resulted in a slightly more stable difference between top and bottom grate temperatures.
I’m Not A Statistician, But I Play One On TVWB
Obviously, these statistics and conclusions are just a snapshot based on three cooking sessions, and I caution readers to not extrapolate these results to other cooking situations, including other cooker firing methods and fuels, different varieties and quantities of meat, longer cooking sessions, and different weather conditions. Still, I hope that in some small way, they give you some insight into what is happening inside your Weber Bullet when you fire it up. And as I said at the beginning of this article, I’ll do more tests along these lines and post the results here in the future.
I invite readers to let me know if I’ve screwed up in any way with this these statistics and conclusions. If I’ve drawn conclusions that are not supported by the data, or I’ve overlooked conclusions that are supported by the data, please let me know so I can correct this article.
More Thermometer & Temperature Links On TVWB
- Installing A Thermometer
- More Thermometer Installations
- Cutting A Probe Thermometer Slot
- Measuring Temperature In The Weber Bullet
- Temperature Control Problems: Too Hot, Too Cool
- Cooking In The Wind, Rain & Cold
- Vent Damper Modifications
- Testing Thermometers For Accuracy: Ice Bath Test & Boiling Water Test
- Boiling Point Calculator
- WSM Modifications Forum on The Virtual Weber Bulletin Board